Your customers are already talking. We help you hear them.
Every review your locations and your competitors get — turned into a clear, ongoing view of who's winning, who's slipping, and what to fix. At whatever cadence your business runs on. With the maths most dashboards skip, done by default.
One dashboard. Four answers. On your cadence.
The reviews are public. The intelligence in them isn't.
Every customer review you and your competitors have ever received is sitting on Google, Tripadvisor, Yelp and the rest — visible to anyone, used properly by almost no one. Each tab below is a different way to turn that public data into something you can act on, from comparing the category to replying to a single customer.
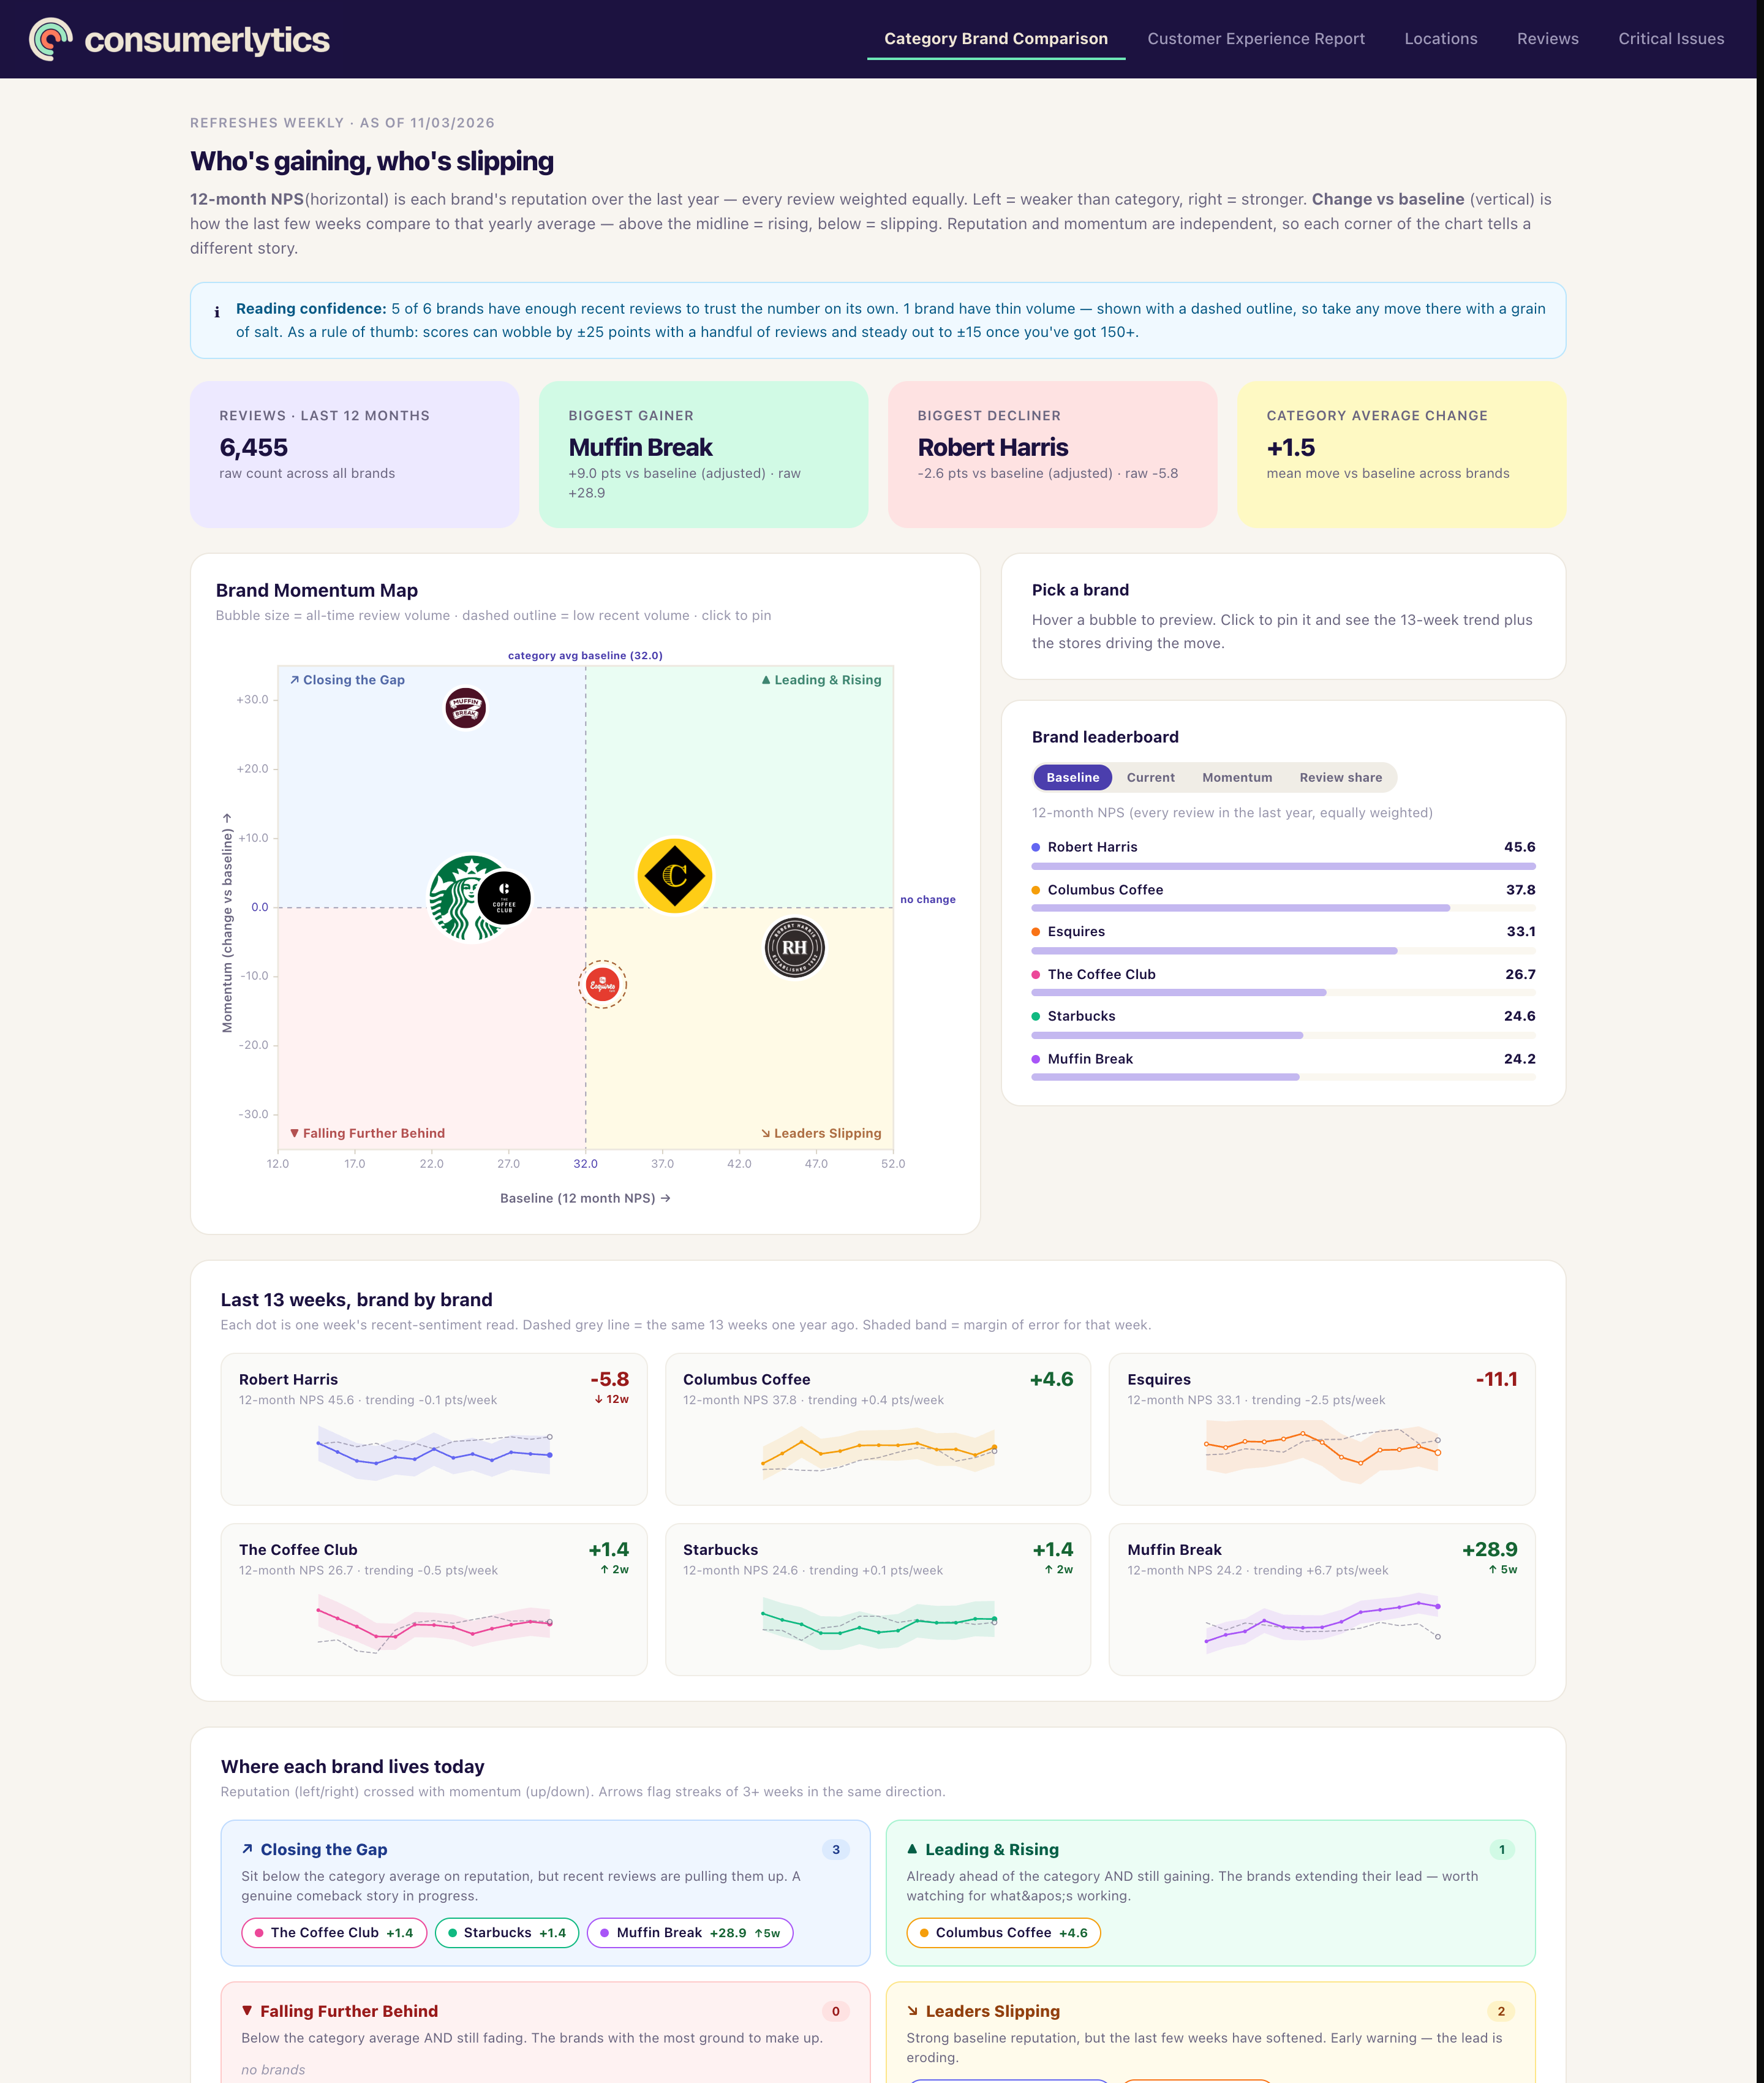
See momentum, not just averages.
View every competing brand on a single chart — reputation on one axis, momentum on the other, number of reviews is the size of the logo. In one glance you can see who the front runners are, who is gaining momentum, and who has share of voice.
- See a leaderboard of competing brands across the key metrics of baseline NPS, recent NPS, momentum, and review share.
- View 13-week trends per brand, with how they performed the same time last year.
- Scores are adjusted for volume, so a brand with five reviews can't accidentally outrank one with five hundred.
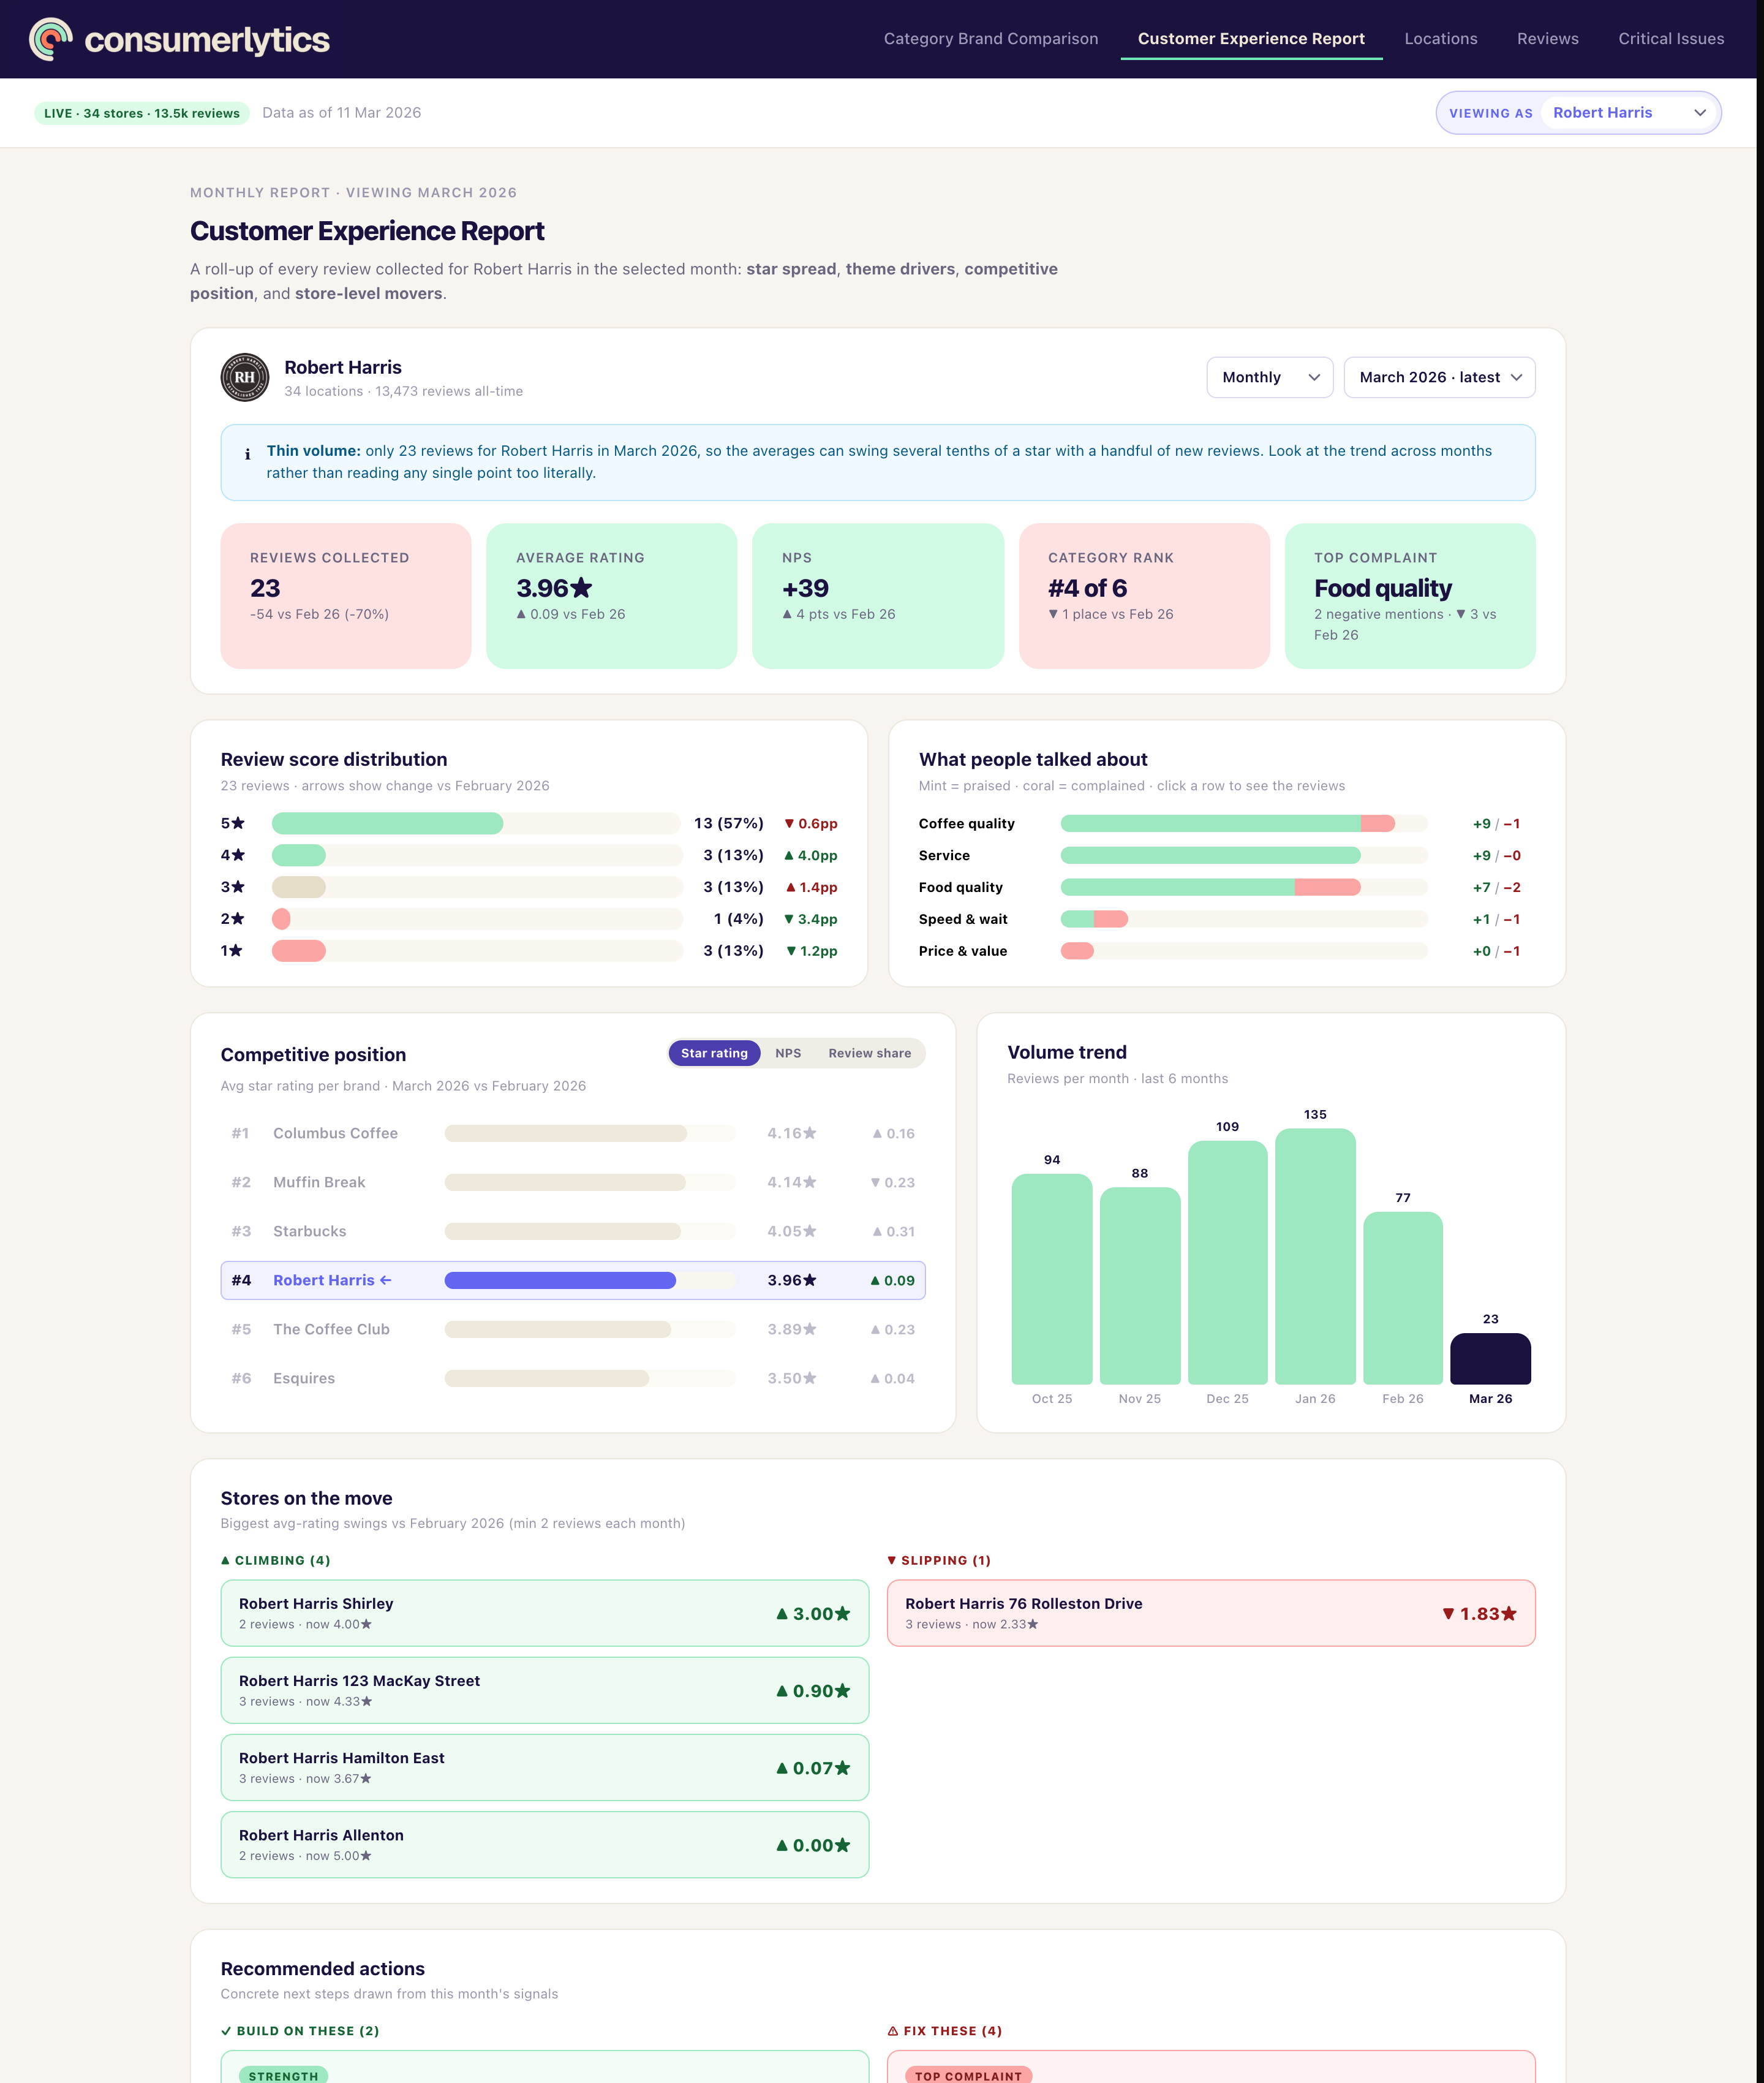
The diagnosis. The to-do list. On one page.
Pinpoints which of your locations is in trouble this period, what their customers are actually complaining about, and what to do first. Every recommendation links straight to the reviews that triggered it.
- “Stores on the move” ranks every location by the size of its swing — improvers in green, decliners in red.
- “Recommended actions” turns the themes driving complaints into a prioritised to-do list — what to fix, where, and why.
- Pick any horizon — weekly, monthly, quarterly, or annual — and the whole report recalculates.
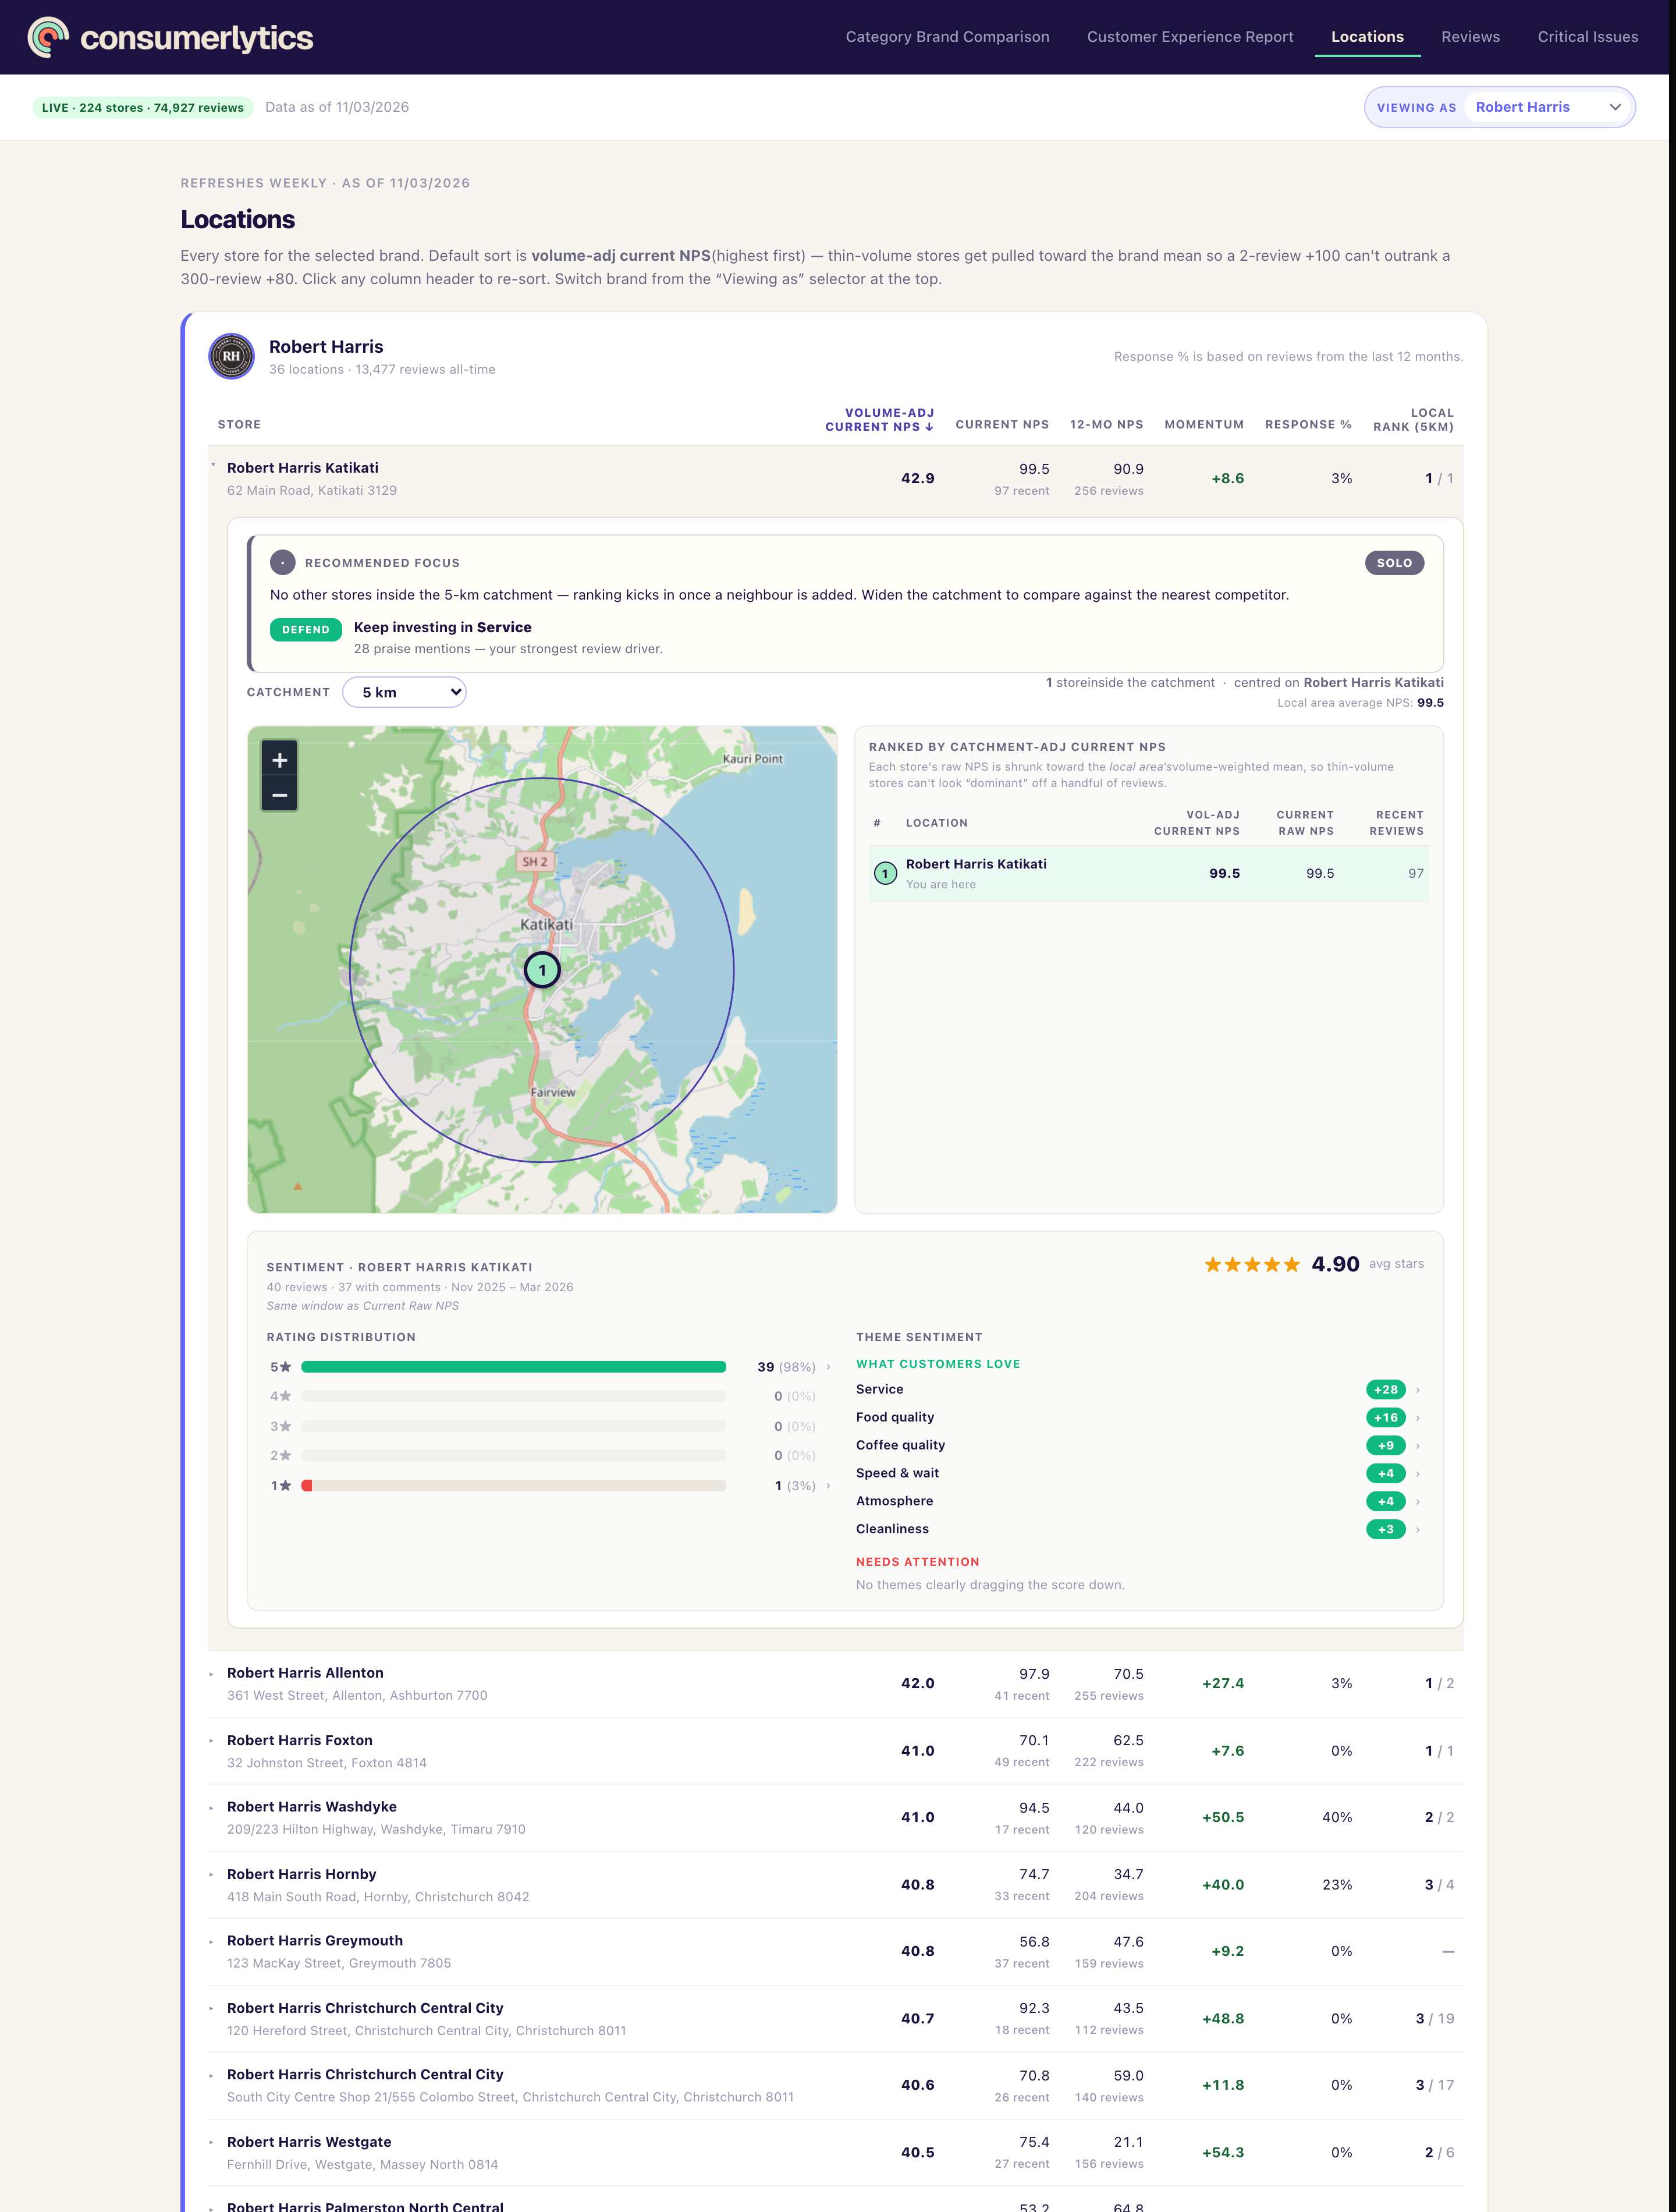
Catchment-aware ranking, not just brand-wide.
Click any of your stores to see how you're performing against your local competition. The ranking re-calibrates for each location — so “who dominates around here” answers correctly, instead of just reflecting brand-wide reputation.
- Configurable 1–100 km catchment around any store
- Ranked brands within that catchment area
- Per-store sentiment + theme breakdown derived from the underlying reviews
- Recommended focus per location based on local sentiment themes
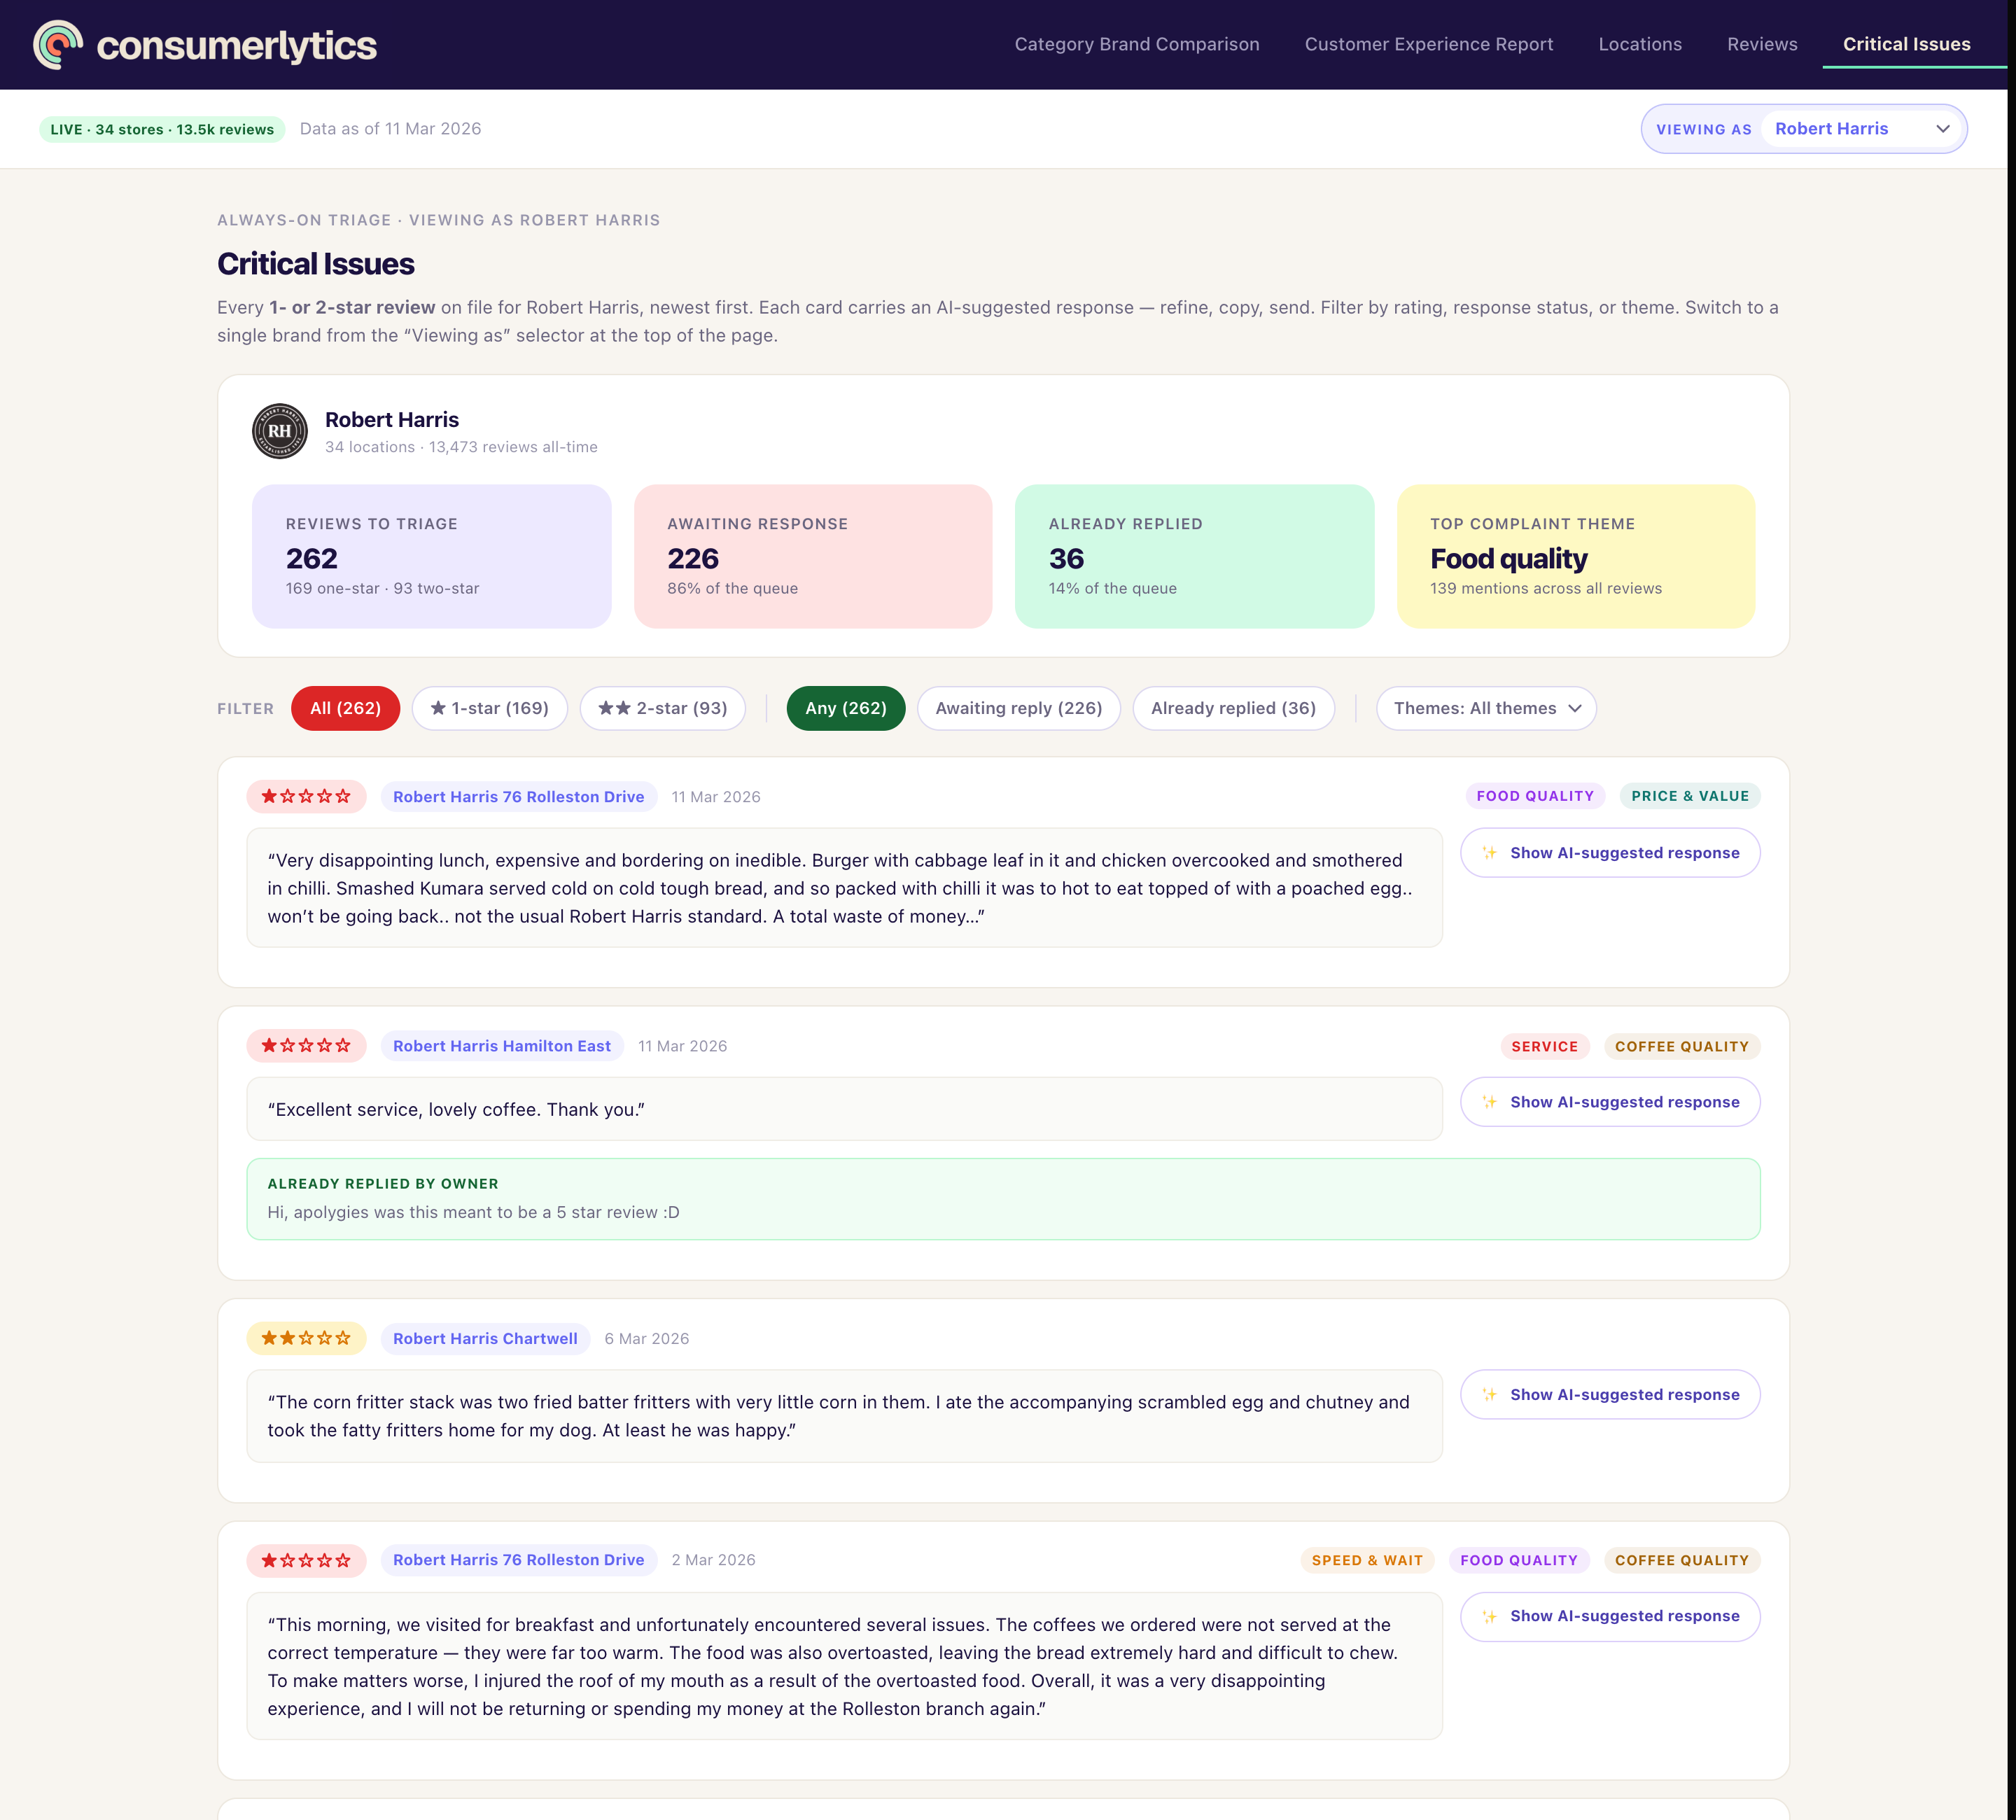
Every angry customer. With a draft response ready.
Surfaces every recent negative review you haven't replied to, scoped by sentiment, theme, and star rating. For each one, an AI drafts a response that fits the kind of complaint — apologetic for service failures, curious for ambiguous feedback, gracious for misposted positives.
- Theme multi-select scopes to a single concern (“show me all parking complaints”)
- Filter by responded / unresponded so a manager can clear a queue
- Inline KPI strip: how many to triage, how many awaiting response, top complaint theme
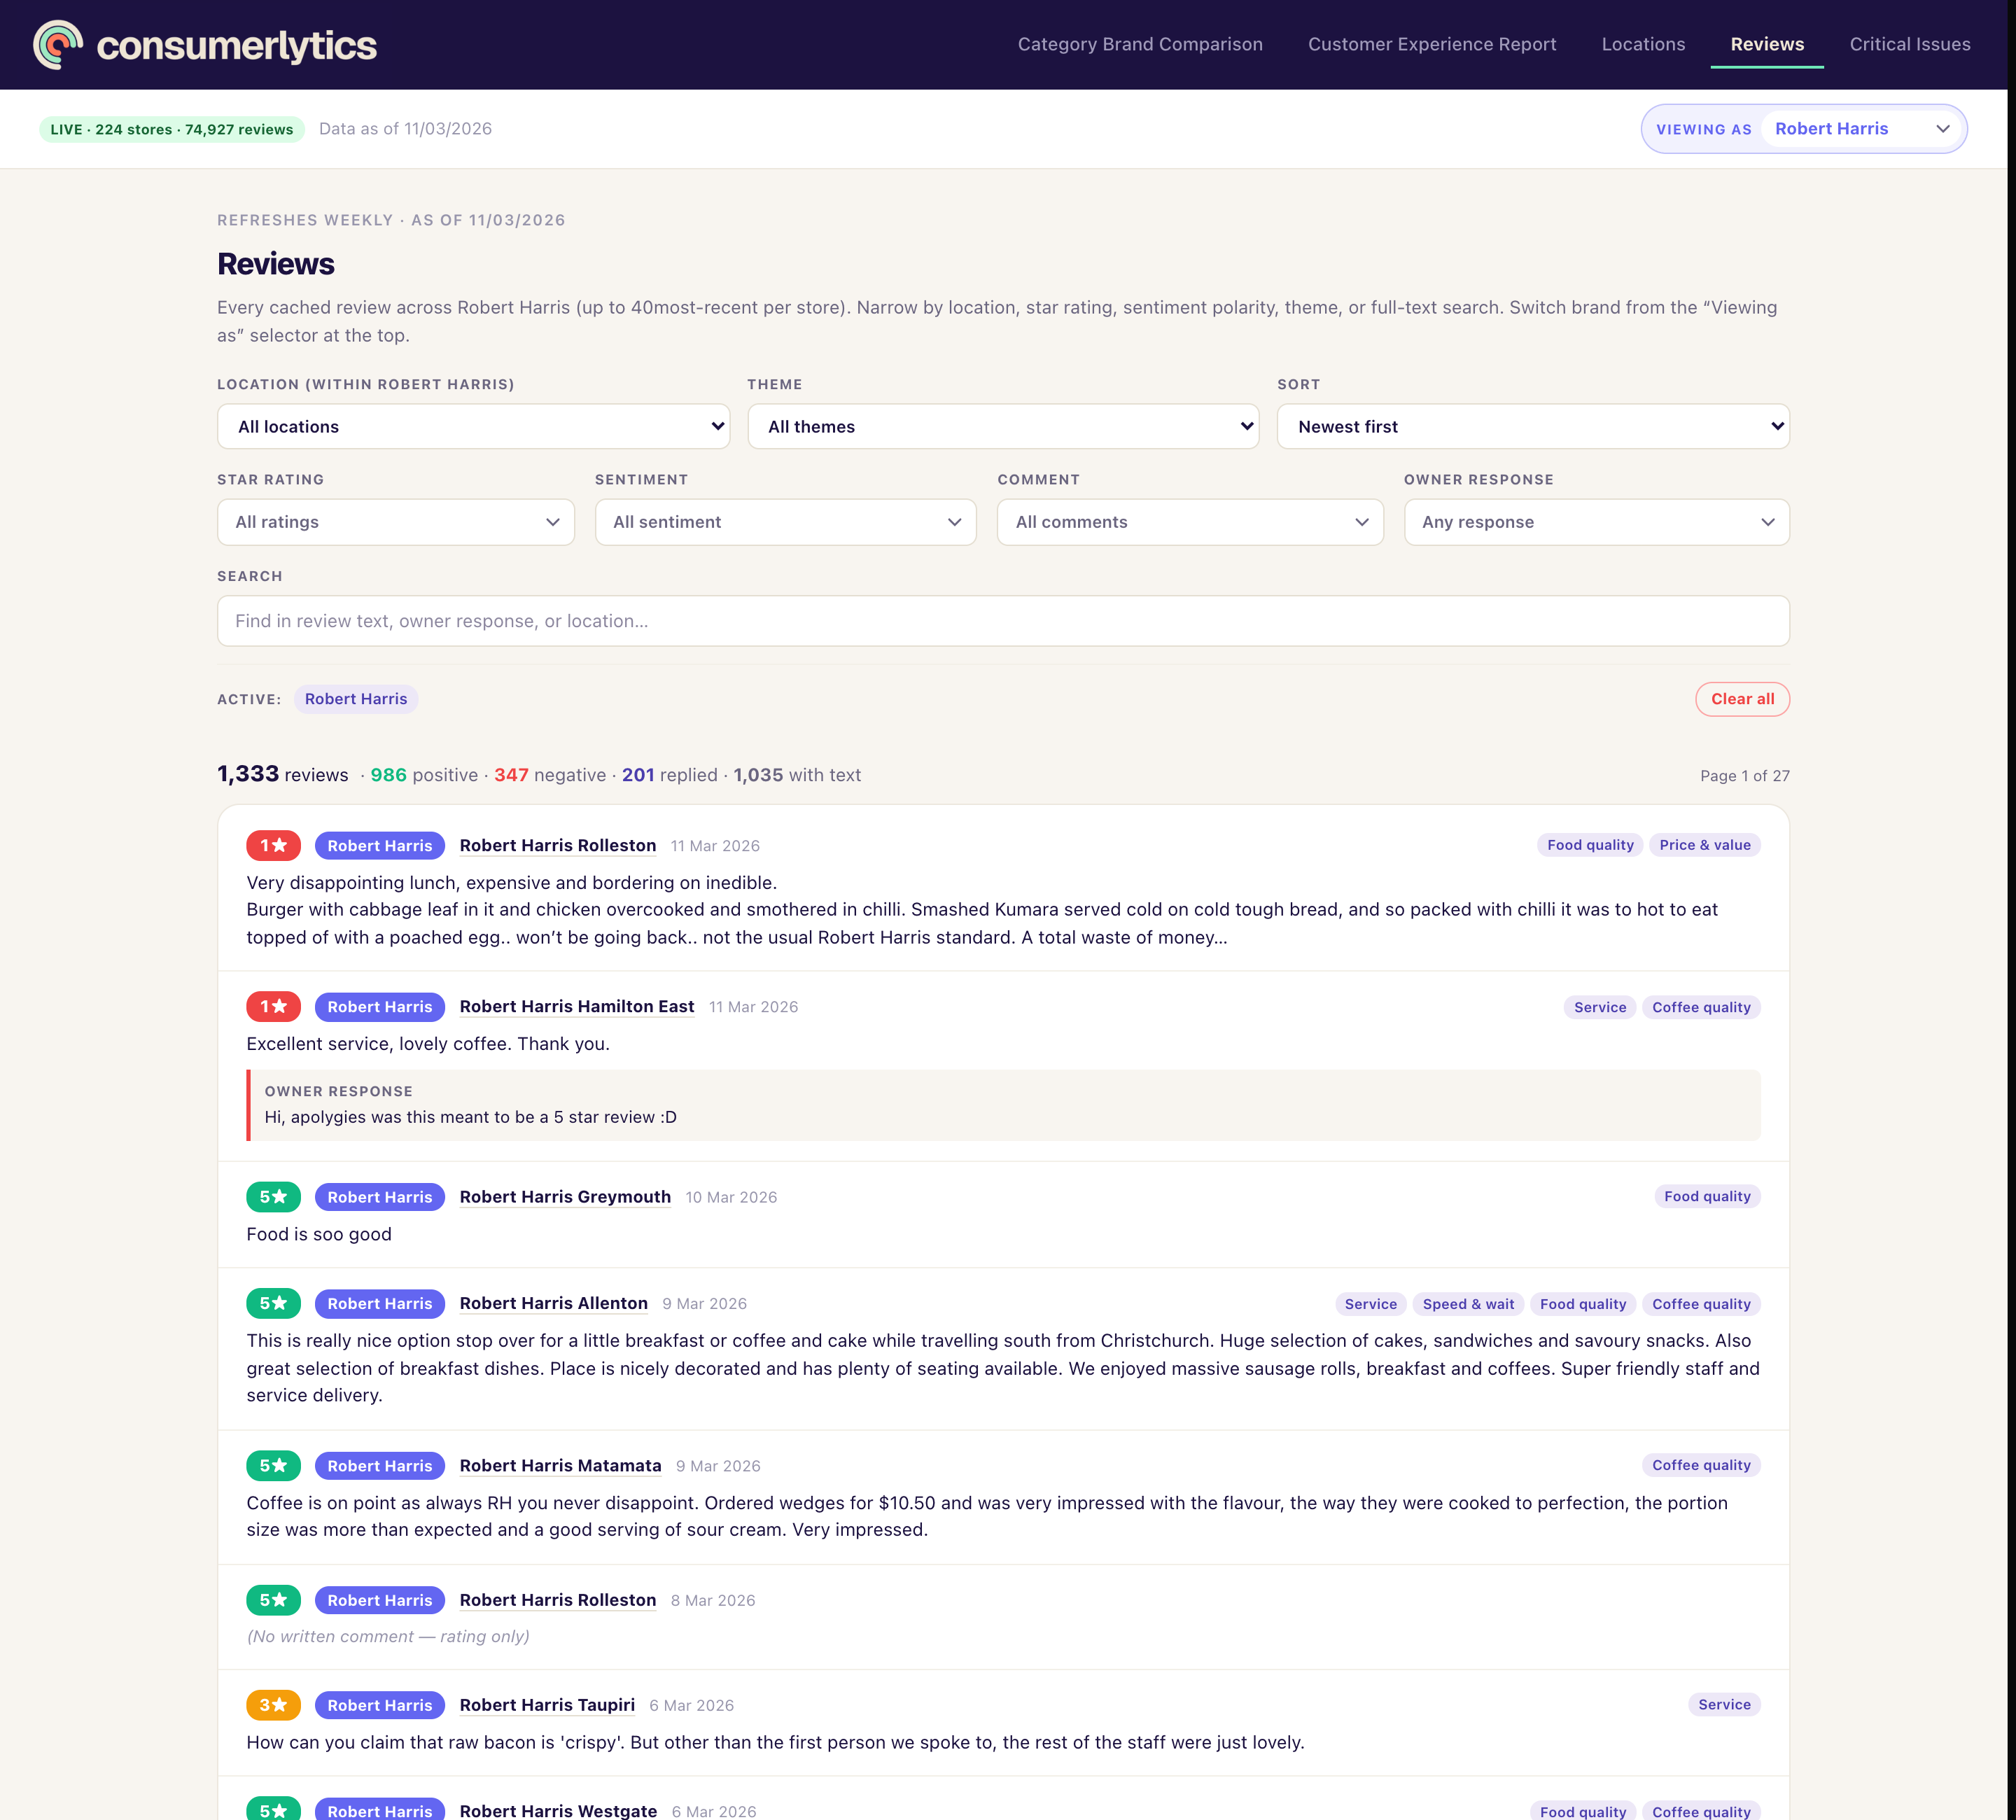
The full feed. Six filters. One row.
Every review across every location, sliceable seven ways: location, theme, star rating, sentiment, comment length, owner-response status, and full-text search. The tab managers open when they want to verify a number on another tab.
- Multi-select dropdowns — combine “negative + food quality + unresponded” in one filter
- Inline owner-response display so reply quality can be audited at a glance
- Per-store sentiment colour chips for fast scanning
Five details most dashboards get wrong. Five reasons your business should care.
A 4.9★ average from a handful of reviews can mislead anyone. So can a flat trend on thin data. We catch both — and three other ways your numbers can lie — before they reach your dashboard.
Time-weighted NPS with effective sample size
Recent reviews are weighted more heavily than older ones, but nothing is thrown away — so a service slip from three weeks ago surfaces fast, while one bad month two years ago doesn't drag the read. The effective sample size keeps the maths honest about how much signal you actually have, so you know when a number is solid and when it's thin.
Empirical-Bayes shrinkage
Every score is pulled toward the right average by an amount that depends on how many reviews back it up. So a new store with five glowing reviews can't become your benchmark, and a quiet branch with three complaints can't trigger a false alarm. The rankings reflect reality, not noise — and you stop chasing problems that don't exist.
Custom sentiment classifier
Generic models fail at review English: “not bad” gets flagged negative; “great service BUT…” gets flagged positive. Ours is purpose-built for it. So when the dashboard says food quality is your top complaint, food quality is your top complaint — your team isn't apologising for praise or missing the real issues.
Streak + magnitude double-test
A single bad weekend will wobble any number. A real move only fires when two things line up: the swing exceeds the margin of error AND the trend has held for 3+ weeks. So the alerts you get are worth acting on, and the noise stays in the noise — your team isn't reorganising the roster every Monday over nothing.
Year-over-year shadow on every trend
Cafe traffic tanks in summer. Mall foot traffic dips after Christmas. Every trend sits in front of last year's shadow — so you can tell the difference between actually slipping and a seasonal pattern that always happens this time of year. The conversation moves from “why is this dropping?” to “is this real?”
In one line
Every number in the product has earned the right to be there — backed by maths most dashboards skip, framed in language an operator can act on. Quiet confidence beats breathless gradients.
Same product on every plan. Only your footprint changes the price.
Every plan ships the full dashboard, every feature, every refresh. The only thing that scales with the price is how many locations you cover. 14-day free trial — no credit card. Save 2 months when you pay annually.
- Up to 8 competitors (additional competitors charged extra)
- All 5 dashboards, weekly refresh
- AI-drafted responses for negative reviews
- Catchment-aware competitor analysis
- Multi-period reports (weekly → annual)
- Email and SMS alerts
- Onboarding call
- Up to 8 competitors (additional competitors charged extra)
- All 5 dashboards, weekly refresh
- AI-drafted responses for negative reviews
- Catchment-aware competitor analysis
- Multi-period reports (weekly → annual)
- Email and SMS alerts
- Onboarding call
- Up to 8 competitors (additional competitors charged extra)
- All 5 dashboards, weekly refresh
- AI-drafted responses for negative reviews
- Catchment-aware competitor analysis
- Multi-period reports (weekly → annual)
- Email and SMS alerts
- Onboarding call
- Up to 8 competitors (additional competitors charged extra)
- All 5 dashboards, weekly refresh
- AI-drafted responses for negative reviews
- Catchment-aware competitor analysis
- Multi-period reports (weekly → annual)
- Email and SMS alerts
- Onboarding call
All prices NZD, exclusive of GST. Add-ons available on every plan: additional competitors, additional brands, SSO/SAML, white-labelling, custom data sources beyond Google & Tripadvisor, custom statistical models, and dedicated environments.
Ready to see your reviews like this?
30-minute walkthrough. No slide deck. 24 hours and we can have your locations and competitors on your own dashboard.